

Section 7.3: Space Weather and Prediction #
A rising solar flux index is usually good news for the upper HF bands. A rising K-index is not. Both numbers trace back to the Sun, which affects radio in three ways. Steady radiation builds the ionization that returns signals, flares can add absorption within minutes, and disturbances carried by the solar wind can upset Earth’s magnetic field hours or days later. Space-weather reports track each one.
Radiation and Sudden Blackouts #
The solar flux index, a radio measurement made at 10.7 cm, tracks the Sun’s ionizing ultraviolet only indirectly. Satellites above the atmosphere can watch that ultraviolet directly. One strong line, at 304 angstroms (30.4 nanometers), rises and falls with solar activity.
Key Information: The 304A solar parameter measures UV emissions at 304 angstroms, correlated to the solar flux index.
A flare works much faster. Its burst of X-rays reaches Earth’s sunlit side in about 8 minutes and raises D-region absorption. For minutes to a few hours, the D region may absorb HF signals before they reach the F region. A busy band can go so quiet you might wonder if your antenna came down. Flares are classed by peak X-ray intensity as A, B, C, M, or X, with a number for strength within the class. Each letter marks ten times the intensity of the one before.
Key Information:
- Solar flares cause short-term radio blackouts.
- Class X indicates the greatest solar flare intensity.
A flare and a coronal mass ejection, or CME, often occur together but are different events. A CME throws off a cloud of plasma with its own magnetic field, and its effects at Earth arrive hours to days after the flare’s light-speed radiation.
Both can also make noise. Flares, and the shock waves that CMEs drive through the Sun’s outer atmosphere, give off bursts of broadband radio noise that reach receivers on Earth’s sunlit side.
Key Information: A sudden rise in radio background noise across a large portion of the HF spectrum indicates that a coronal mass ejection impact or a solar flare has occurred.
A local noise source can sound much the same, so check current X-ray and solar radio reports before blaming the Sun.
The Field Carried by the Wind #
Whether an arriving CME, or a fast stream of solar wind, stirs up a geomagnetic storm depends partly on the magnetic field it carries. That interplanetary magnetic field, or IMF, matters most through its north-south direction. On the side facing the Sun, Earth’s own field points northward. A southward IMF runs opposite to it, so the two fields can link up and let solar-wind energy in. A northward IMF mostly slides past.
Key Information:
- represents the north-south strength of the interplanetary magnetic field.
- A southward orientation of increases the likelihood that charged particles from the Sun will cause disturbed conditions.
Plots show a southward (“B sub z”) as negative. Look at how long it has stayed south, not just at the latest value; a brief dip predicts little.
Earth’s response shows up in the K-index and A-index: K for each three-hour period, on a scale from 0 to 9, and A for the whole day. NOAA also rates geomagnetic storms on a five-step scale, starting at G1 for a minor storm. The top step matches a planetary K-index of 9. NOAA’s R and S scales rate radio blackouts and solar radiation storms the same way.
Key Information:
- A rising A-index or K-index indicates increasing disturbance of the geomagnetic field.
- G5 is the space-weather term for an extreme geomagnetic storm.
A space-weather report puts these numbers side by side, and a flare’s X5 and a storm’s G5 describe very different events.
Where Absorption Grows #
A high K-index hits some paths much harder than others. Earth’s magnetic field guides charged particles toward high latitudes. There, auroral activity concentrates in a ring around each magnetic pole: the auroral oval. A disturbance intensifies the oval and pushes it toward the equator. Incoming particles add ionization low in the ionosphere, where collisions absorb radio energy.
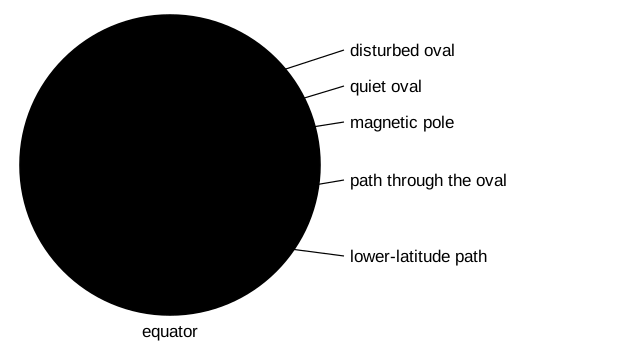
Key Information: A signal path through the auroral oval is most likely to experience high levels of absorption when the A-index or K-index is elevated.
That’s bad news for an East Coast station working Japan: the short path runs near Alaska’s Arctic coast.
Models and Reports #
Planning a contact calls for a forecast for that route, band, and time. VOACAP, the Voice of America Coverage Analysis Program, works from the stations’ locations, the month and hour, the frequency, and the expected level of solar activity.
Key Information: VOACAP software models HF propagation.
Its predictions describe typical conditions for that hour across the month, not what the band is doing today.
To see what is actually happening, check propagation-reporting networks such as the Reverse Beacon Network and PSK Reporter. Their receiving stations report the call sign, frequency, time, and signal strength or signal-to-noise ratio of each signal they decode. That works only for signals a computer can decode by itself.
Key Information: Amateur radio propagation reporting networks report digital-mode and CW signals.
Call CQ for a few minutes, and these networks can show where your own signal landed.
Use models to guide the search, reports to test the forecast, and your own receiver to examine the path you can actually use.



 UV emissions at 304 angstroms, correlated to the solar flux index