Section 2.2: Drawing Complex Impedance #
Connect an antenna analyzer to a feed line, and it might report instead of a single number. The extra information lets us distinguish resistance from reactance and tell whether a load is inductive or capacitive. Plotting the reading lets us see those differences and work out their combined effect.
Two Directions, One Impedance #
Resistance and reactance affect phase differently, so we cannot add them along one line to find impedance . We draw them in two directions instead, at right angles. A graph that locates each point by how far across and how far up or down it lies uses rectangular coordinates. Here both coordinates are in ohms. A pure resistance has no reactance at all.
Key Information:
- When graphing impedance in rectangular coordinates, the X axis represents the resistive component and the Y axis represents the reactive component.
- The impedance of a pure resistance is plotted on the horizontal axis.
Watch the labels here, because the names collide: the graph’s “X axis” is horizontal, while the quantity called —reactance—goes vertically. A point such as means “50 across, 25 down.”
Rectangular notation, , holds the same information as that point. The letter marks the reactance part, drawn at right angles to resistance. Inductive reactance points upward and has a plus sign. Capacitive reactance points downward and has a minus sign, like the in our analyzer’s reading.
This two-part value is called a complex number. Resistance is its real part; reactance is its imaginary part. “Imaginary” is a math label—the reactance is quite measurable.
Key Information:
- Pure capacitive reactance of 100 ohms is in rectangular notation.
- ohms represents 50 ohms resistance in series with 25 ohms capacitive reactance.
A Length and an Angle #
To find the total opposition to current and its phase angle, draw an arrow from the origin, where both axes read zero, to the impedance point. The arrow’s length is the impedance’s magnitude. Its angle above or below the horizontal axis is the phase angle.
A pure inductive reactance has no resistance, so its arrow points straight up the vertical axis. That matches the inductor in the previous section, whose voltage leads its current by 90 degrees. A pure capacitive reactance points straight down, at −90 degrees.
A phasor is an arrow that represents the magnitude and phase of a sine-wave voltage or current. We draw impedance arrows the same way. Because reactance changes with frequency, each arrow holds for only one frequency.
Key Information:
- Polar coordinates describe impedances by magnitude and phase angle, and are often used to display the phase angle of a circuit containing resistance and reactance.
- In polar coordinates, a pure inductive reactance has a positive 90-degree phase angle.
- A phasor diagram shows the phase relationship between impedances at a given frequency.
Resistance, reactance, and the arrow form a right triangle. The arrow is the diagonal, not the sum of the other two sides.
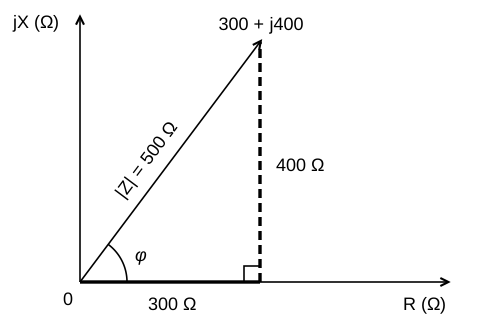
The Pythagorean theorem finds that diagonal: square each of the two sides, add the results, then take the square root. The formula is , where the vertical bars mean “magnitude.” For :
The previous section’s 100 Ω resistor and 100 Ω inductive reactance work the same way: . Driving 1 A through that pair takes about 141 V, not 200 V.
Changing to moves the point below the axis but leaves its distance from the origin unchanged. To tell an inductive load from a capacitive one, you also need the angle.
From a Component to a Point #
Until now, resistance and reactance have arrived already in ohms. Often you’ll know a capacitor or inductor value and a frequency instead. To place that circuit on the graph, first calculate its reactance.
The capacitor formula uses frequency in hertz and capacitance in farads. It gives the reactance magnitude in ohms:
The examples use these unit conversions:
| Given unit | Value in the formula |
|---|---|
| 1 MHz | Hz: one million hertz |
| 1 µH | H: one millionth of a henry |
| 1 pF | F: one trillionth of a farad |
Scientific notation saves typing all those zeros. A calculator’s EE or EXP key usually enters “times ten to the power of,” so 38 pF becomes 38 EE −12 farads. Use the negative-sign key for the exponent. It may display that entry as 3.8E−11; that is the same value.
For a 400 Ω resistor and 38 pF capacitor in series at 14 MHz, work through the bottom of the fraction first:
- Multiply frequency by capacitance: .
- Multiply by (about 6.28): the result is about 0.003343.
- Divide 1 by that result: .
Because this is a capacitor, its reactance points downward. With the 400 Ω series resistor, the impedance is approximately : move right to 400, then down to about −300. Resistance is never negative in these circuits, so their points always lie right of the vertical axis.
The inductor formula skips the final “1 divided by” step. With frequency in hertz and inductance in henries:
Frequency sits on top here and on the bottom of the capacitor formula. That is why raising frequency increases an inductor’s reactance but decreases a capacitor’s.
For a 300 Ω resistor and 18 µH inductor in series at 3.505 MHz, frequency times inductance is . Multiplying by gives about 396 Ω, plotted upward from the 300 Ω resistance position.
A 300 Ω resistor and 19 pF capacitor in series at 21.200 MHz takes the capacitor steps again. Frequency times capacitance is 0.0004028. Multiplying by gives about 0.002531; dividing 1 by that gives about 395 Ω, plotted downward from 300 Ω of resistance.
The graph places these last two reactances at 400 Ω rather than 396 or 395 Ω. The calculator and the graph agree at different levels of precision.
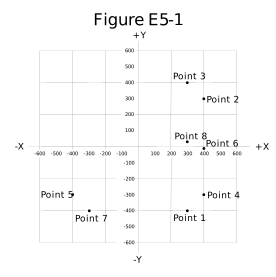
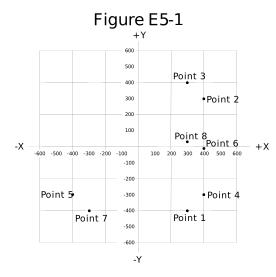
Key Information: In Figure E5-1:
- A 400-ohm resistor and 38-picofarad capacitor in series at 14 MHz give approximately : point 4.
- A 300-ohm resistor and 18-microhenry inductor in series at 3.505 MHz give approximately : point 3.
- A 300-ohm resistor and 19-picofarad capacitor in series at 21.200 MHz give approximately : point 1.
All three magnitudes are close to 500 Ω, yet they’re three different loads. The magnitude alone would never tell them apart.




 The X axis represents the resistive component, and the Y axis represents the reactive component